Extracapsular Extension
By Dan Sperling, MD
This article was posted on www.diagnosticimaging.com on July 19th 2012. To go directly to the original article please click on the following link http://www.diagnosticimaging.com/case-studies/content/article/113619/2091700
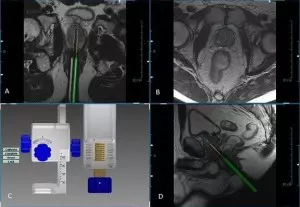
This case represents an excellent example of a situation where a lesion detected with MRI was also biopsied under MRI guidance (figure 3).
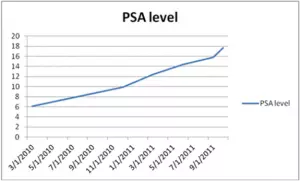
MRI-guided biopsy can solve a diagnostic dilemma in patients with elevated or rising PSA with negative trans-rectal ultrasound-guided (TRUS) biopsy.
He had undergone two TRUS biopsy sessions in May, 2008 and April, 2011. Both were negative. His prostate gland measured 4.6 x 3.9 x 3.5 = 33cc gland volume.
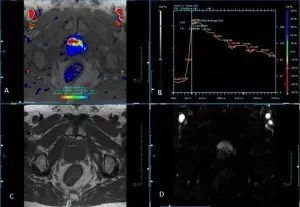
Figure 1. A: DCE with parametric overlay; B.Kinetic curve; C. T1 Axial; D. Subtraction
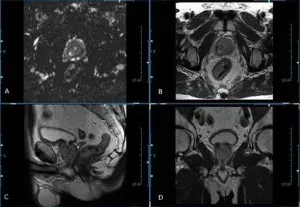
Figure 2. A. DWI Axial; B. T2 Axial; C. T2 Sagittal; D. T2 Coronal
Findings: At MR imaging, there was a 3.1 cm area in the ventral transition zone (TZ) which demonstrated evidence of abnormally decreased T2 signal, restricted diffusion (figure 1)and suspicious (wash-in/wash-out) contrast kinetics (figure 2), findings compatible with prostate cancer (PCa). No gross invasion of the neurovascular bundles (NVBs), periprostatic venous plexus or seminal vesicles (SVs) was seen. There was no evidence of pelvic lymphadenopathy nor were there signal abnormalities in the visualized marrow spaces.
The large lesion in the TZ extended beyond the capsule; however, there was no evidence of bony or distant metastatic disease. Staging was T3a, N0, M0.
This case represents an excellent example of a situation where a lesion detected with MRI was also biopsied under MRI guidance (figure 3).
Figure 3. A. Axial needle confirmation; B. Axial T2; C. DynaLOC planning software; D. Sagittal calibration scan
When the patient returned for his MRI-guided biopsy, only four cores were obtained, all positive for adenocarcinoma and Perineural invasion (table 2).
| Location | Gleason Score | Tumor Size | % Cancer Involvement |
| Left Base Lateral | 8 (4+4) | 13.6mm | 85% |
| Left Base Medial | 8 (4+4) | 17mm | 100% |
| Right Base Medial | 8 (4+4) | 14mm | 100% |


